Print Sales Statistics

The WideRange Galleries admin system includes a comprehensive prints sales statistics panel with visual charts and graphs that provide valuable insight into which photos sell, when they sell, and where they sell. Not only is this information just interesting to see, it can help you make more informed marketing decisions.
With this integrated statistics tool, you can chart your print sales by history, years, months, photos, galleries, print sizes, display options, customers, states, and countries – and for any of those you can sort the data by number of prints sold or gross income. A variety of interactive charts and maps are provided to help visualize all this data. The statistics program will automatically keep track of your print sales to populate this data.
I will share a few of these screenshots and tidbits from my own photography website so you can see how useful these statistics can be. (I’ve blocked out the numbers for privacy). Of course many of the statistics and lessons I glean from this are unique to my photography business, but it's still interesting to share.

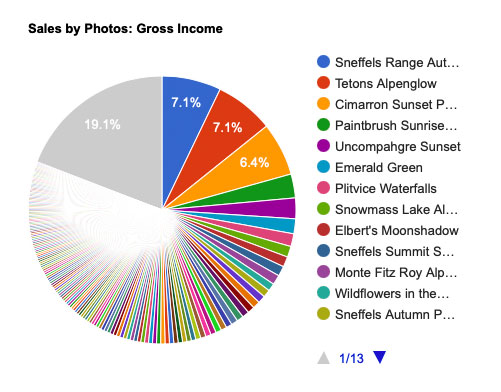
Looking at the print sales by photo, I find it remarkable how out of nearly 4,000 photos on my website, just three of them provide fully 20% of print sales income!
What this tells me is that I need to keep those top photos front-and-center on my website to have them seen by as many visitors as possible. I will also try to feature these photos more prominently in other forms of marketing, whether as prints hanging in galleries or cafes, or sharing them more often through social media networks.
This also brings up the point that I've found it to be very beneficial to have a prominent "Bestsellers" gallery on my website. There is a reason why certain photos resonate with lots of people - I don't know exactly what that reason is, but the numbers don't lie. By grouping the bestselling photos into one prominently-featured gallery on the website, it serves those most popular photos to viewers right away rather than expecting people to browse through all the different galleries to find them.
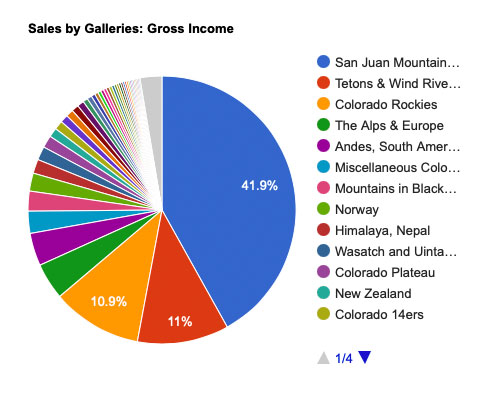
The admin can also show you statistics of how much income is generated by each gallery on the website. My galleries are organized by location, and when I add up the various Colorado galleries' sales, I can see that a whopping 60%+ of all my print sales are of photos from Colorado (despite the fact that I have photos from many other states and around the world).
From these stats I know that I need to keep my Colorado galleries prominent in my website and perhaps expand them to several different Colorado gallery topics to further harness the Colorado interest.
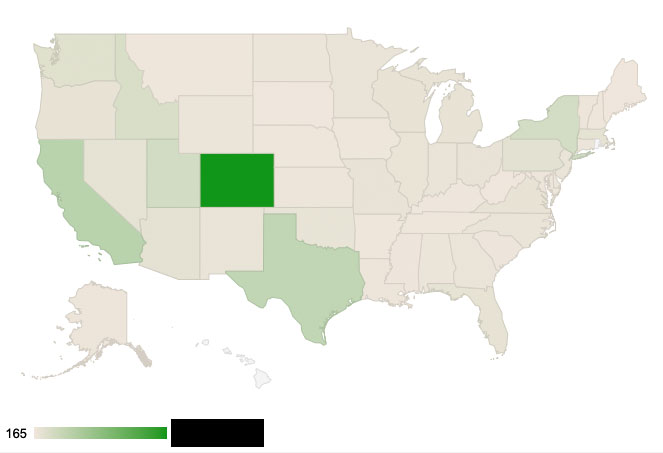
Even more interesting is to view the sales by state. Although I've sold prints to customers in every state (except Hawaii and Rhode Island), it's clear how important my Colorado customers are with over a third of all sales in-state. This and the galleries chart above show me that by far the largest chunk of my customers are Coloradans buying Colorado prints. So now I know that if I want to do targeted advertising, it would serve me well to target customers primarily within Colorado as well as perhaps California and Texas.

It's also useful to see patterns of high sales and slower times from month to month. As you can see in the chart above which is a total compilation of all sales organized by month, there’s a bit of fluctuation, with the obvious Christmas bump happening in November and December. This helps me gauge roughly what to expect for income month to month, or when to send out newsletters perhaps to offer discounts to spur sales during the slow months.
These are the most interesting charts to share, but there are also graphs to show the best selling print sizes and display options, the top customers, sales by country, and more. As you can see this data is very useful for making informed decisions on how to structure your gallery website as well as for various marketing efforts.
Please contact me if you have any questions about this website feature!